Nowadays, most of the service requires massive size of database. For example, let’s think you are making e-commerce service. In early days, it only needed to save data for items(item image, description…) and user(ID, email, address…) which are necessary for commerce. But, to attract more user, it started to offer more personalized information, such as ‘recommend items’. To investigate user likes, they need to research more detail user pattern/logs , and database increased explosively.
Elasticsearch, and ELK stack
Elasticsearch is search/analytics engine based on Lucene. It provides a distributed, multitenant-capable full-text search engine with HTTP REST web interface. In official guide, it saids:
Elasticsearch is a highly scalable open-source full-text search and analytics engine.
It allows you to store, search, and analyze big volumes of data in near real time...
Most important point is, it is very fast, much more than searching from RDBMS using SQL query. In case of e-commerece service explained above, it can be used to store full catalog, and send auto-complete result to user quickly.
Because of these advantages, it was being used as an engine for massive raw text data, such as log data of server, network, and more. As Elastic knew about this usage, they created an end-to-end stack which calls ELK stack(or Elastic stack) that delivers actionable insights in real time.

ELK is acronym of Elasticsearch, Logstash, and Kibana. Logstash is data processing pipeline that ingest data from multiple source and transform it. Kibana is a tool which visualize data inside Elasticsearch with chart/graph.
Boot Elasticsearch and Kibana
You can download each package from official site, or by brew if you are MacOS user.
$ brew install elasticsearch
$ brew install kibana
$ brew install logstash
If installed well, first run Elasticsearch and Kibana.
$ $ elasticsearch
Java HotSpot(TM) 64-Bit Server VM warning: Cannot open file logs/gc.log due to No such file or directory

[2018-10-21T22:32:45,707][INFO ][o.e.n.Node               ] [] initializing ...
[2018-10-21T22:32:45,800][INFO ][o.e.e.NodeEnvironment    ] [XwChsFl] using [1] data paths
...
...
[2018-10-21T22:32:56,772][INFO ][o.e.n.Node               ] [XwChsFl] started
[2018-10-21T22:32:56,784][INFO ][o.e.g.GatewayService     ] [XwChsFl] recovered [0] indices into cluster_state
[2018-10-21T22:33:26,751][INFO ][o.e.c.r.a.DiskThresholdMonitor] [XwChsFl] low disk watermark [85%] exceeded on [XwChsFluRIGjqONsrmaPuA][XwChsFl][/usr/local/var/elasticsearch/nodes/0] free: 27.5gb[11.5%], replicas will not be assigned to this node
As mentioned above, it offers HTTP interface to access data. Default access point is http://localhost:9200, so let’s try some simple access to check it runs well.
$ curl -X GET localhost:9200
{
  "name" : "XwChsFl",
  "cluster_name" : "elasticsearch_user",
  "cluster_uuid" : "_BvcZeP5RkW9W9Gix726Dw",
  "version" : {
    "number" : "6.4.2",
    "build_flavor" : "oss",
    "build_type" : "tar",
    "build_hash" : "04711c2",
    "build_date" : "2018-09-26T13:34:09.098244Z",
    "build_snapshot" : false,
    "lucene_version" : "7.4.0",
    "minimum_wire_compatibility_version" : "5.6.0",
    "minimum_index_compatibility_version" : "5.0.0"
  },
  "tagline" : "You Know, for Search"
}
Okay, now open new terminal window and start Kibana.
$ kibana
  log   [03:27:18.694] [info][status][plugin:kibana@6.4.2] Status changed from uninitialized to green - Ready
  log   [03:27:18.745] [info][status][plugin:elasticsearch@6.4.2] Status changed from uninitialized to yellow - Waiting for Elasticsearch
  log   [03:27:18.943] [info][status][plugin:timelion@6.4.2] Status changed from uninitialized to green - Ready
  log   [03:27:18.953] [info][status][plugin:console@6.4.2] Status changed from uninitialized to green - Ready
  log   [03:27:18.957] [info][status][plugin:metrics@6.4.2] Status changed from uninitialized to green - Ready
  log   [03:27:19.042] [info][listening][server][http] Server running at http://localhost:5601
  log   [03:27:19.302] [info][status][plugin:elasticsearch@6.4.2] Status changed from yellow to green - Ready
  ...
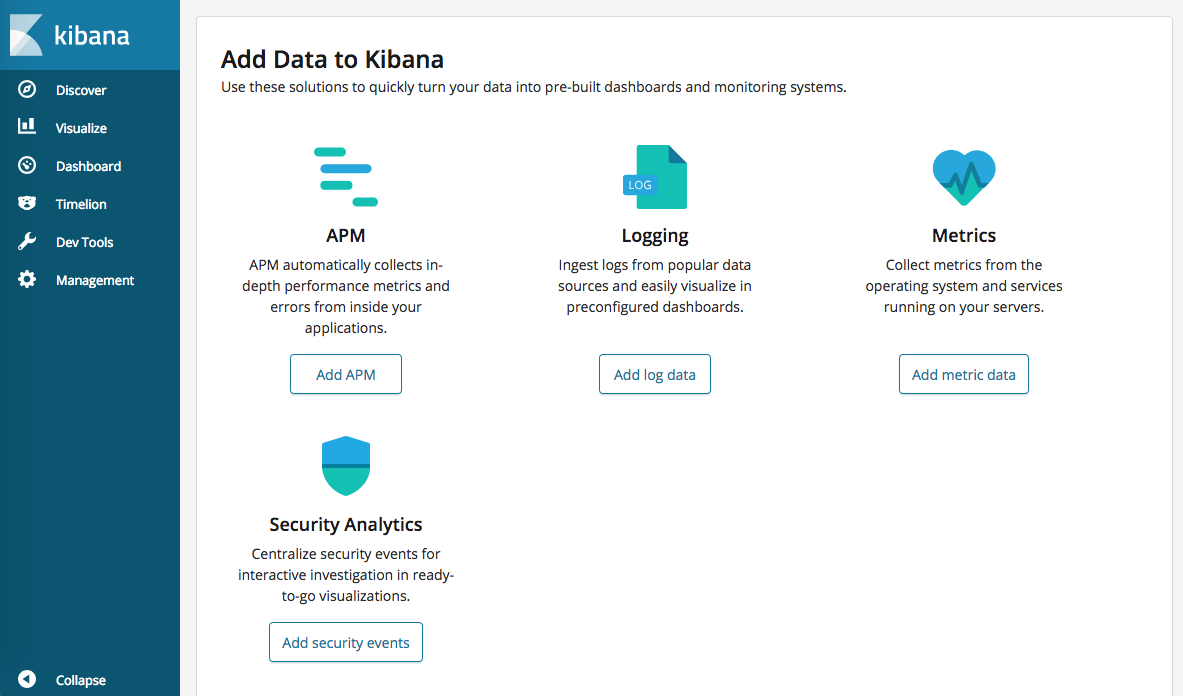
Now access to http://localhost:5601 and you’ll see main template page of kibana.
Pull logs with Logstash
Logstash pulls data from multisource, and transform with unified format. Because this is just basic, I’ll try with single file, with single Nginx log format. As you see below, Nginx log includes requested IP, Date, Type, API, etc..
93.180.71.3 - - [17/May/2018:08:05:32 +0000] "GET /downloads/product_1 HTTP/1.1" 304 0 "-" "Debian APT-HTTP/1.3 (0.8.16~exp12ubuntu10.21)"
Now I’ll put some log data into logstash. Because I don’t have one, I’ll download dummy log data from elastic/example repository. I changed date a bit because it was too old.
To setup logstash to pull the data, it needs to be defined as conf file. This is how I did.
input {
  file {
	path => ["/path/to/log/data/*.txt"]
	start_position => "beginning"
	sincedb_path => "/path/to/store/sincedb"
  }
}

filter {
  grok {
    match => {
      "message" => '%{IPORHOST:remote_ip} - %{DATA:user_name} \[%{HTTPDATE:time}\] "%{WORD:request_action} %{DATA:request} HTTP/%{NUMBER:http_version}" %{NUMBER:response} %{NUMBER:bytes} "%{DATA:referrer}" "%{DATA:agent}"'
    }
  }

  date {
    match => [ "time", "dd/MMM/YYYY:HH:mm:ss Z" ]
    locale => en
  }

  geoip {
    source => "remote_ip"
    target => "geoip"
  }

  useragent {
    source => "agent"
    target => "user_agent"
  }
}

output {
  elasticsearch {
    hosts => ["http://localhost:9200"]
    index => "nginx_elastic_stack_example"
  }
}
First, data in input { } and output { } defines where log comes in/out. So as you can expect array defined in ‘input > file > path’ is the target where logstash will pull the data. You could know what is ‘start_position’ well. It only has 2 option, ‘beginning’ and ’end’. ‘sincedb_path’ defines the path of database which will keep track of the current position of monitored log files. Setup to make logstash keep tracking the status of tracking data.
filter is pretty important point, because this part take charge of transforming raw data into easily readable/researchable form.
‘grok’ is to parse arbitrary text and structure it. Inside match, you need to define text pattern matches with your log. It has lots of defined pattern(and could make your own, but will not go on that further) which fits to various type of log data, such as ‘HTTPDATE’, ‘IPORHOST’, ‘NUMBER’. And, defined data in here, can be used and transformed into new format in other filters. For example, in ‘geoip’, it reads the source ‘remote_ip’ which defines in ‘grok’, and transform into location information.
For more information, look on input and filter guide.
Visualize logs in Kibana
Now, send log into elasticsearch
$ logstash -f your-logstash-conf-file.conf
[2018-11-04T17:57:55,384][INFO ][logstash.runner          ] Starting Logstash {"logstash.version"=>"6.4.2"}
[2018-11-04T17:58:01,272][INFO ][logstash.pipeline        ] Starting pipeline {:pipeline_id=>"main", "pipeline.workers"=>4, "pipeline.batch.size"=>125, "pipeline.batch.delay"=>50}
[2018-11-04T17:58:02,130][INFO ][logstash.outputs.elasticsearch] Elasticsearch pool URLs updated {:changes=>{:removed=>[], :added=>[http://localhost:9200/]}}
[2018-11-04T17:58:02,147][INFO ][logstash.outputs.elasticsearch] Running health check to see if an Elasticsearch connection is working {:healthcheck_url=>http://localhost:9200/, :path=>"/"}
[2018-11-04T17:58:02,501][WARN ][logstash.outputs.elasticsearch] Restored connection to ES instance {:url=>"http://localhost:9200/"}
...
[2018-11-04T17:58:04,251][INFO ][filewatch.observingtail  ] START, creating Discoverer, Watch with file and sincedb collections
[2018-11-04T17:58:04,789][INFO ][logstash.agent           ] Successfully started Logstash API endpoint {:port=>9600}
Now go into Kibana, and you will see something:
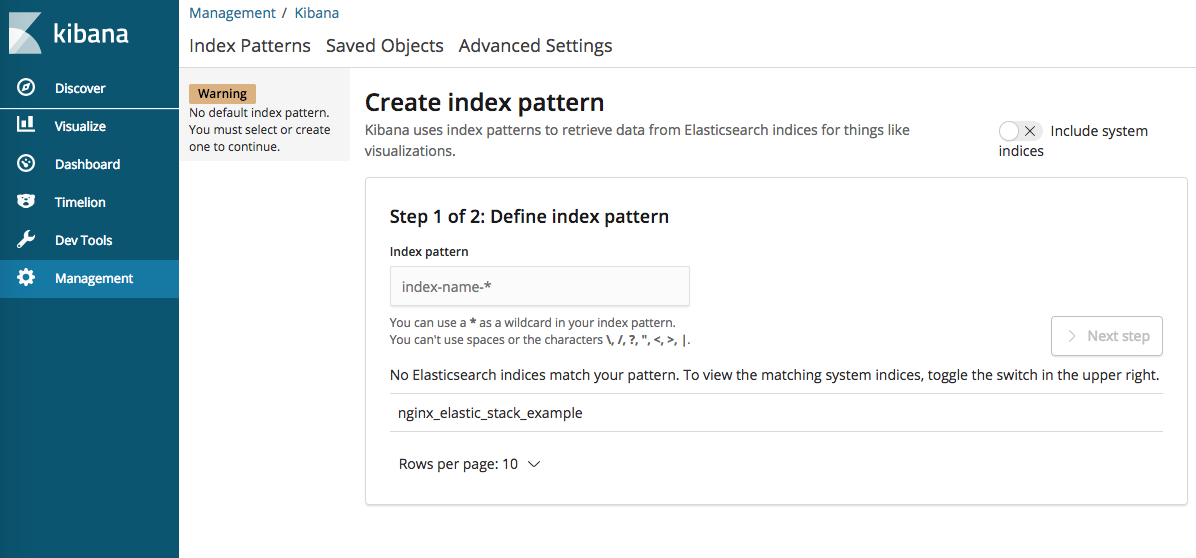
you could see ’nginx_elastic_stack_example’ which defined in ‘output’ setting in logstash conf file. Now create index pattern:
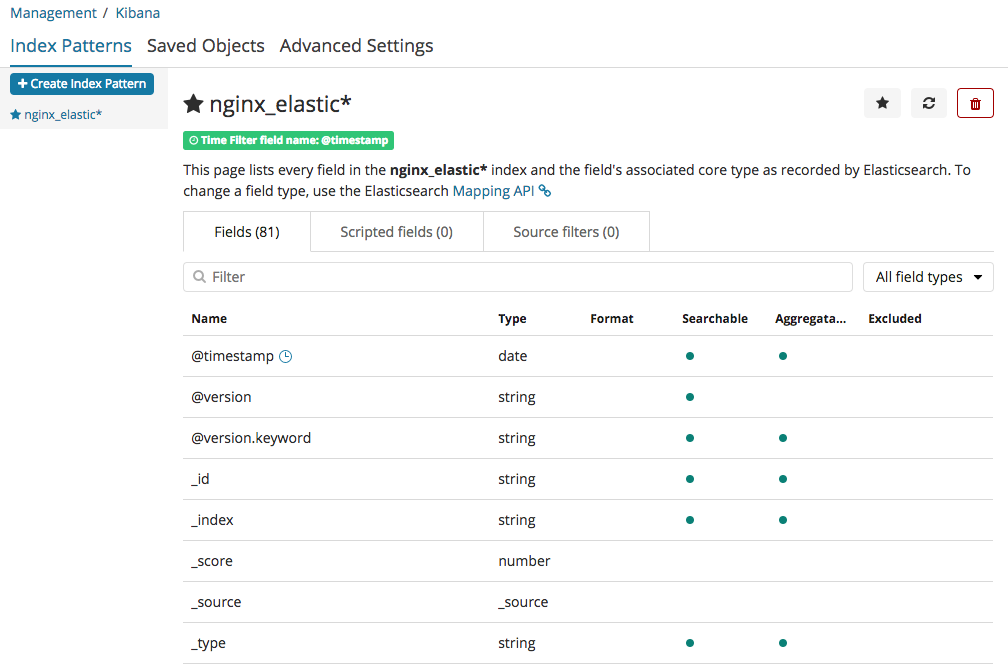
Now this index pattern stores the field which recognized from output we got from logstash. Go into menu ‘discover’ in left navigation menu.
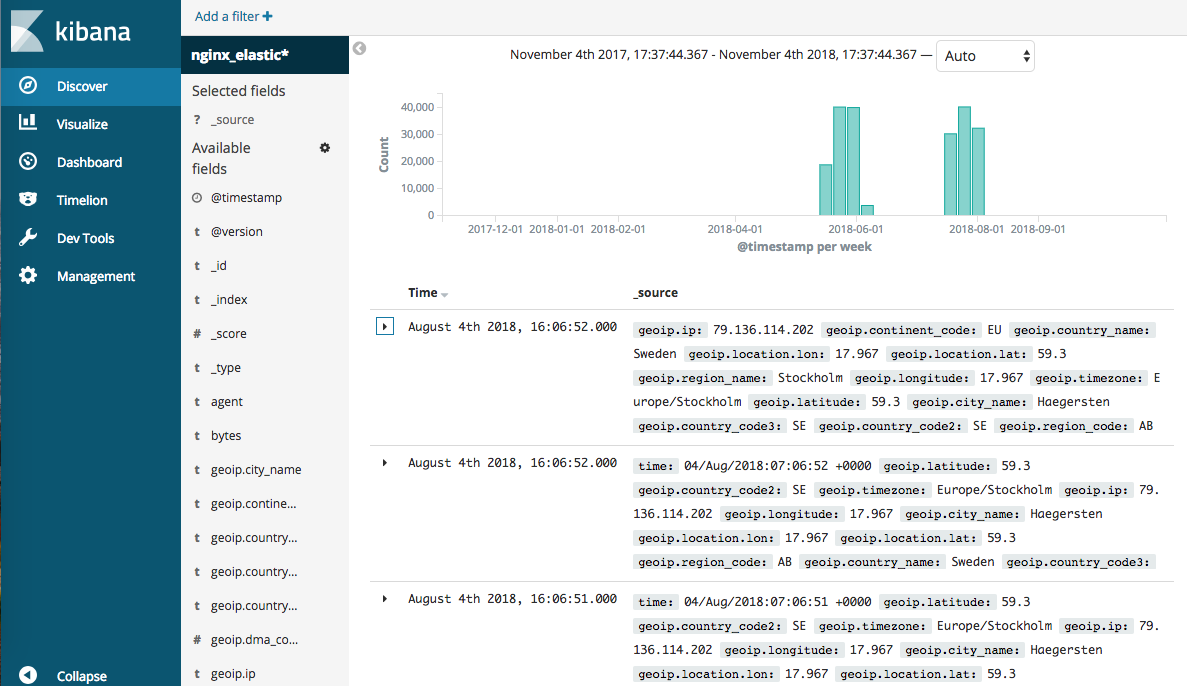
If you select saved index pattern, it shows the summary data of log. Because we generated location data from IP, we can figure out not only the count of log by date, but also where this has been requested.
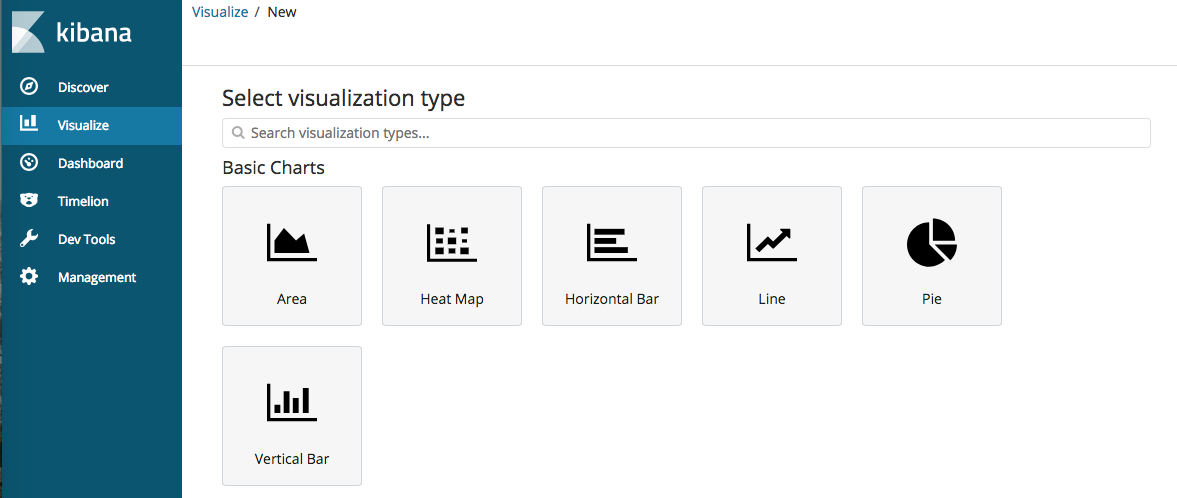
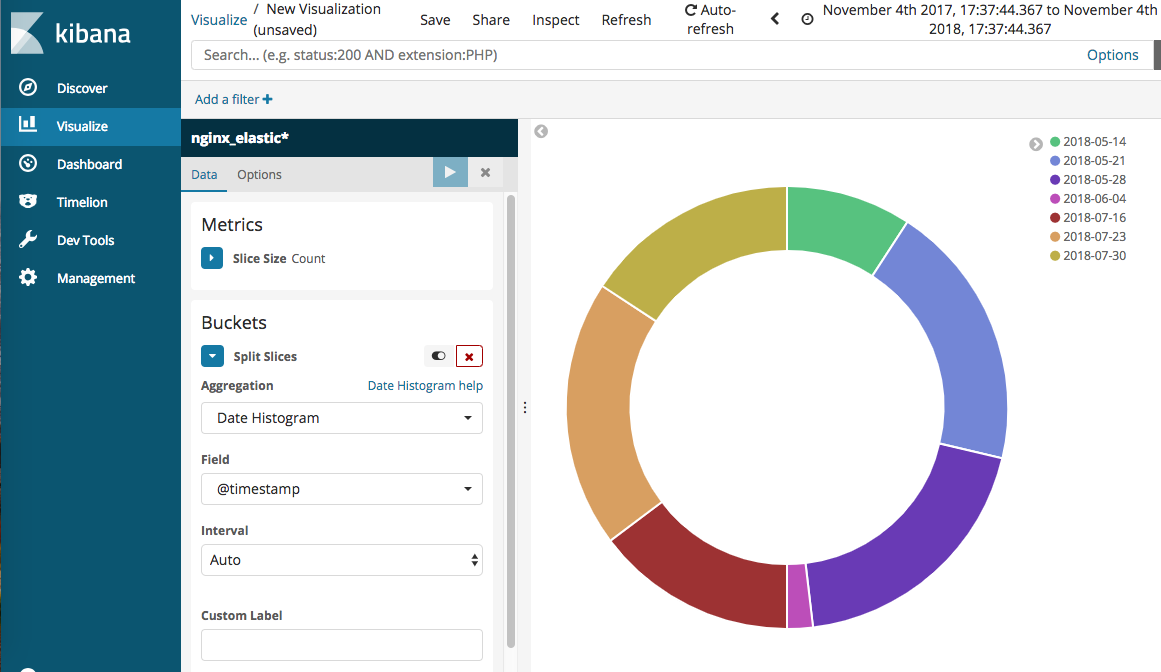
With collected data, we could generate chart/graph by given templates. Below one is simple Pie chart of log count by date.
